

Data Visualization
Start with beginner-friendly projects such as newsfeed analysis using Tableau dashboards to track engagement trends.
Data Visualization
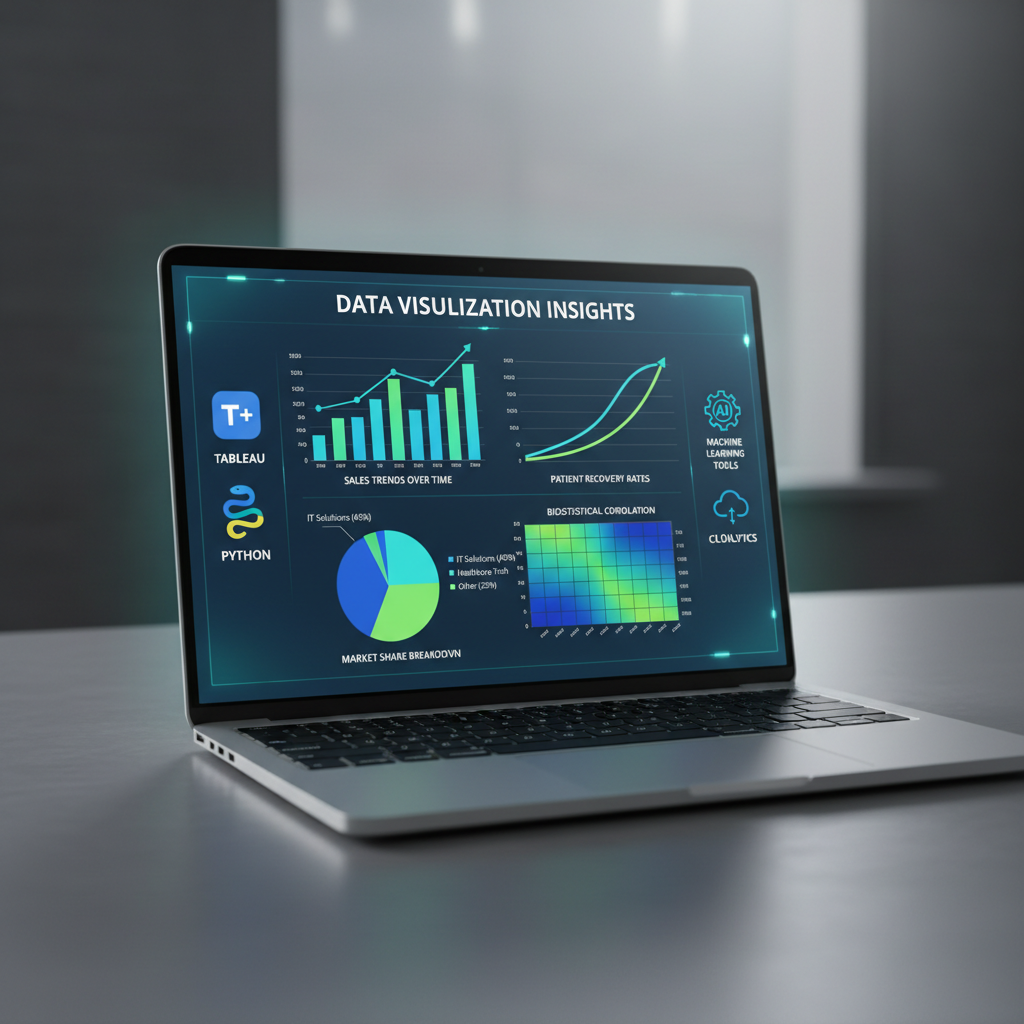
Data visualization transforms complex datasets into clear, engaging visuals like charts and infographics. It converts raw numbers into meaningful visual stories. The goal is to simplify information for better understanding. Visuals help people grasp insights quickly. Charts and graphs reveal hidden patterns in data. Infographics combine visuals with brief explanations. Data visualization supports effective communication. IT professionals use it to explain technical data. Data scientists rely on visuals for analysis and reporting. Healthcare industries use visualization to track patient trends. Clinical data becomes easier to interpret with dashboards. Hospitals monitor performance metrics using visual tools. Business organizations use visuals to measure growth. Sales data is often presented through charts. Marketing teams analyze campaign performance visually.
STATDOC's Revenue Cycle Management Solutions
Revenue Cycle Management
Optimize financial operations and billing processes for healthcare organizations, ensuring maximum reimbursement and reduced administrative burden.
RCM Data Analytics
Leverage advanced data analysis to uncover trends, identify revenue opportunities, and optimize billing and claims processes for superior financial performance.
Claims Management & Compliance
Ensure seamless claims submission, reduce denials, and maintain regulatory compliance to accelerate cash flow and protect revenue integrity.
RCM Strategy & Training
Develop robust RCM strategies and empower your staff with expert training in billing, coding, and financial performance optimization.